Control limits are the backbone of SPC. They're the invisible guardrails that tell you when something's gone wrong in your process. But here's the thing – a lot of people confuse control limits with specification limits, and that confusion can lead to bad decisions.
Control limits come straight from your actual data. They show the natural variation in your process when everything's running normally. Once you know what "normal" looks like, you can spot the abnormal stuff immediately.
Think of it like learning someone's handwriting. At first, all writing looks the same. But once you've read their notes for a while, you instantly notice when something's off – maybe the pressure's different, or the angles have changed. That's what control limits do for your process.
- Control limits come from your own data and show what "normal" looks like for your process.
- They are not the same as specification limits - mixing them up leads to bad decisions.
- A point outside the limits, or a pattern in the points, is your chart telling you something has changed.
What Are Control Limits Anyway?
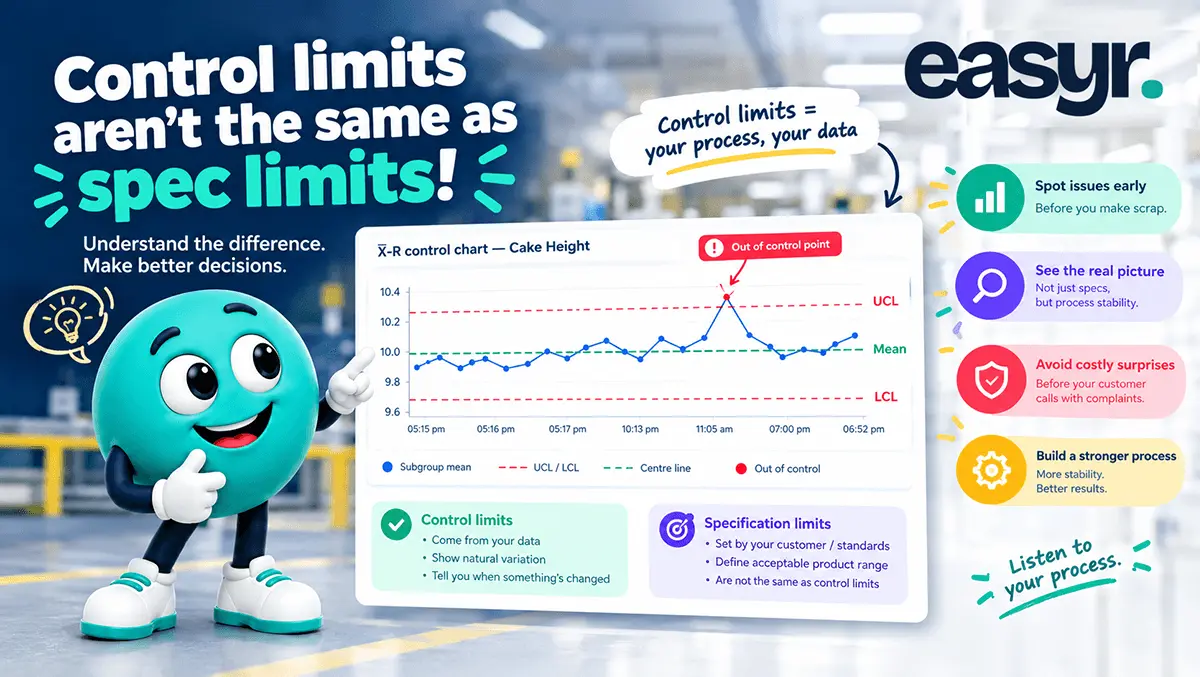
 Control limits are calculated boundaries on a control chart that define the expected range of your process when it's behaving normally. They're not the same as your specification limits (which are set by your customer or standards) and they're definitely not the same as your tolerance limits.
Your control limits come from statistics – specifically, they're usually set at 3 standard deviations from your process mean. That fancy maths is already built into any decent SPC system, so you don't need to worry about the calculations. What you need to understand is what the limits mean when you're looking at your data.
The upper control limit (UCL) and lower control limit (LCL) form a band around your process average. When your measurements stay within that band, your process is said to be "in control" – meaning it's behaving predictably. When measurements fall outside those limits, something's changed.
The Difference That Changes Everything
Here's where people get confused: your specification limits and your control limits are completely different animals.
- Specification limits are what your customer (or your standards body, or your boss) says the product should be. They're hard requirements. If a product is outside specification, it's scrap or rework.
- Control limits are about your process capability. They tell you whether your process is stable and predictable. A process can be in control but still making out-of-spec products. And a process can be out of control but still (temporarily) making spec parts.
This distinction matters because it changes how you react. If you hit an out-of-spec product, you need to investigate and fix the process. If your control chart shows an out-of-control signal, you absolutely need to find and fix the root cause, because you're losing stability.
Reading the Signals
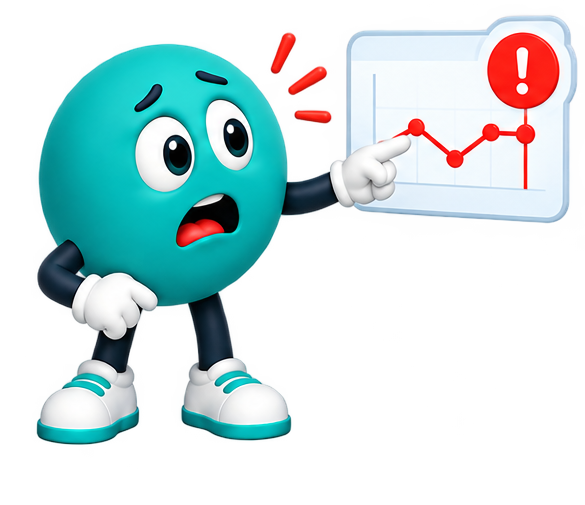 Your control chart is trying to talk to you. A single point outside the control limits is a signal that something unusual happened. Maybe an operator changed the setup, maybe a tool wore out, maybe someone forgot to zero the gauge.
But control charts are cleverer than that. They also look for patterns:
- Eight points in a row on one side of the center line? That's a signal too.
- A steady trend, getting higher or lower? Signal.
These patterns tell you that something's changing in your process, even if you haven't hit an out-of-control point yet.
Modern SPC systems flag these signals automatically. Your operators don't need to be statisticians to understand "the control chart is telling us something's changed." The system does the heavy lifting and just tells them what to look for.
Why This Matters for Your Business
Control limits let you catch problems early:
- Before you make scrap
- Before your customer calls with complaints
- Before you waste materials and time
When you understand control limits, you're not just looking at numbers – you're looking at the voice of your process. And once you learn to listen to it, you make smarter decisions faster. Your teams move from reactive ("we have a problem") to proactive ("we're about to have a problem, let's fix it now").

Let the system do the maths
Easyr works out your limits and flags the signals, so your team can focus on what the chart is telling them. Have a chat with us and we'll show you how it works.
Get in touch