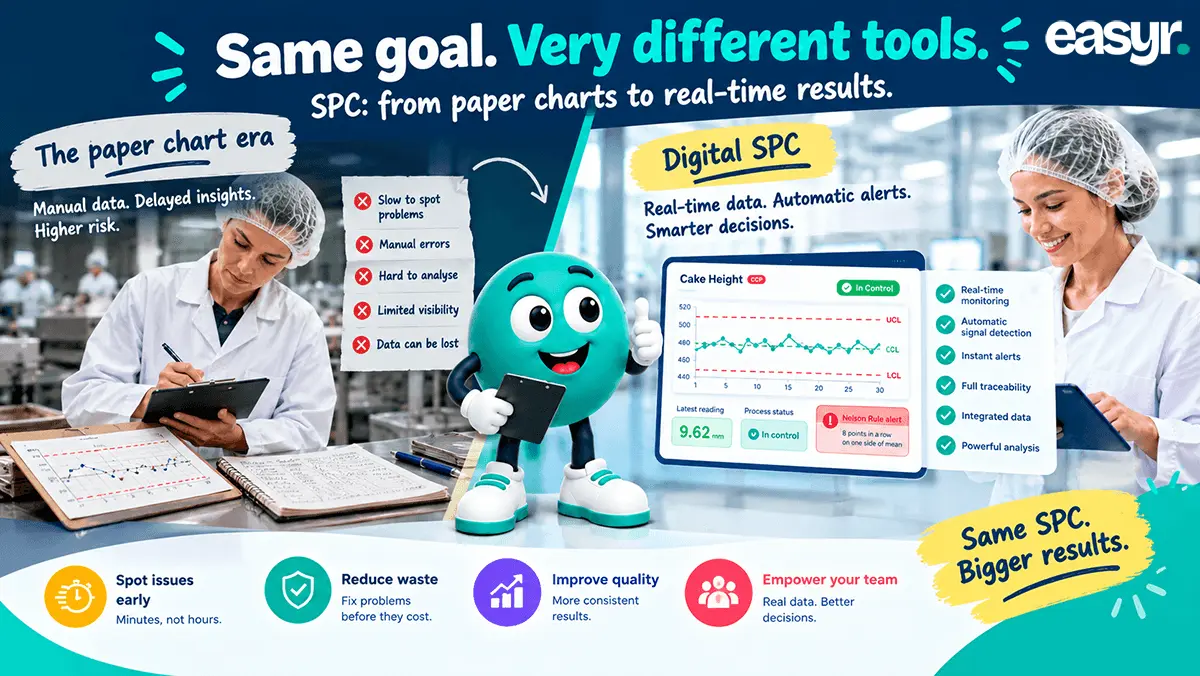
Picture this: an operator with a clipboard, checking a measurement every hour, writing it down in a logbook, then taking that notebook to someone in quality who plots points on a paper chart by hand.
Now picture this: the same operator taps a measurement into a system that automatically collects it, plots it on a digital chart, flags any signals, alerts the supervisor, and logs everything for analysis.
Both are SPC. But one is stuck in 1995, and one is positioned to actually solve problems in real-time.
- Paper charts work, but they're slow, easy to get wrong and easy to lose.
- Digital SPC catches problems in minutes, automatically, and keeps every record safe.
- The best setup is digital for the heavy lifting, plus a printed dashboard on the wall.
The Paper Chart Era

Paper charts work. People used them for decades. You manually collect data, manually plot points, manually watch for signals. The process is transparent – you can see everything right there on the wall.
But there are some real limitations:
- Lag time: A problem happens at 10 AM, but you don't plot it until 3 PM when quality checks the chart. By then you've made 500 parts.
- Manual error: Writing mistakes, transcription mistakes, plotting mistakes. Numbers get copied wrong. Points get plotted in the wrong place.
- No analysis: Complex analysis like trend detection or pattern recognition requires someone to sit down and really study the chart. Operators often miss patterns that jump out at a trained eye.
- No integration: The chart is data. Everything else – production records, material data, environmental conditions – is somewhere else. Connecting them requires manual work.
- No alerting: Nobody's watching the chart 24/7. Signals might go unnoticed for hours. Third shift probably isn't reviewing charts at 2 AM.
- Loss of data: That notebook goes missing. The chart gets water damaged. The logbook's at home with the operator who called in sick. You lose months of data.
Digital Systems Change the Game
Modern SPC software automates the heavy lifting and opens up possibilities paper never could.
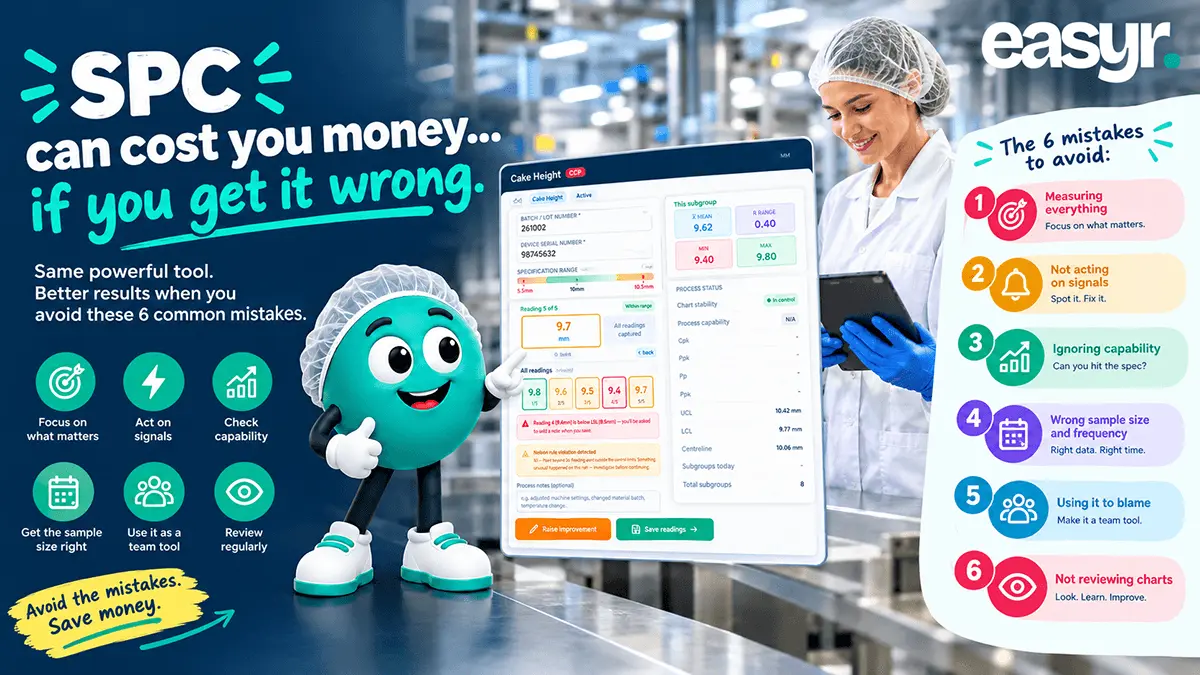
- Real-time monitoring: Measurement happens, data goes into the system immediately, chart updates instantly. Signal detection happens automatically. The supervisor gets an alert. Problem is caught within minutes, not hours.
- No transcription errors: Data flows directly from the measurement device (or operator input) into the system. No writing, no copying, no mistakes.
- Automatic signal detection: The system looks for control chart signals constantly. Out of control points, runs, trends, shifts – all detected automatically according to standard SPC rules. You won't miss anything.
- Data integration: The system can connect to other data. Material batch information, environmental data, production schedules, maintenance logs. When a signal occurs, you can correlate it with other factors. “All the signals happened with material from supplier B.”
- Alerts and notifications: Signal detected? The supervisor gets an alert. Maybe via email, maybe via text, maybe the system just puts it on a dashboard. Either way, you know immediately.
- Reporting and analysis: Generate capability reports. Trend analysis. Comparison of periods. Identify chronic problem areas. All generated automatically from stored data.
- Audit trail: Everything is logged. Who looked at what, when changes were made, what decisions were recorded. Perfect for audits and compliance.
The Cost-Benefit Trade
Digital systems cost more upfront. Software, licensing, possibly new equipment, training. That's real money.
But consider what you're paying for:
- Faster problem detection: Catching a developing problem in hours instead of days can save you thousands in scrap. Over a year, that adds up to way more than software licensing costs.
- Better data: Reduced transcription and plotting errors means better data. Better data means better decisions.
- Automatic analysis: You get insights you'd never find manually. You don't have time to sit down and analyse six months of control chart data by hand. The system does it in seconds.
- Real root cause analysis: Instead of “the chart went out of control” you can say “the chart went out of control every time we received material from supplier B.”
For most manufacturers, the ROI happens quickly. You catch a few problems early and the software has paid for itself.
The Human Element
Digital SPC doesn't replace operator knowledge – it amplifies it. The system does the data collection and analysis. The operator does the problem-solving and improvement.
A good digital system makes it easier for operators to understand what's happening. Clear dashboards. Visual signals. Simple explanations. “The temperature trend is climbing. Click here to see the last eight measurements.”
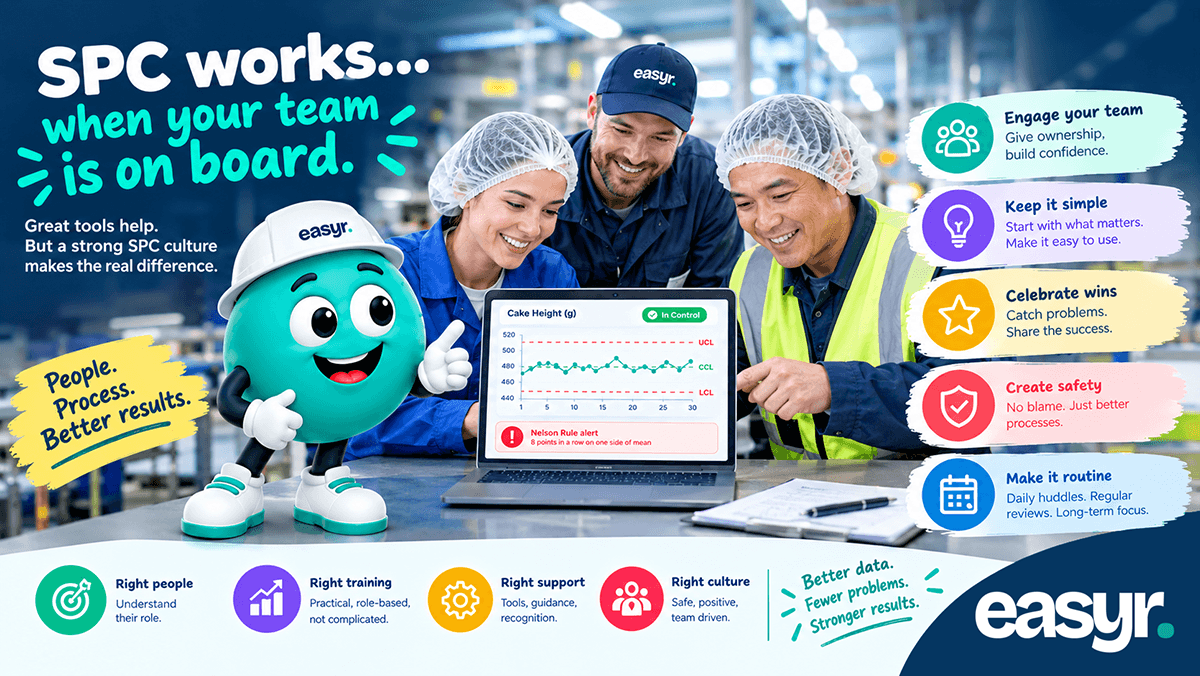
Some people worry that digital systems make SPC less visible – that printing charts on a dashboard is less impactful than having a big chart on the wall. Fair point. That's why smart manufacturers do both: digital systems for automated monitoring and analysis, plus printed dashboards in the production area so everyone can see what's happening.
Integration Into Workflows
Modern SPC software integrates into your existing workflows. When a signal occurs, it might automatically:
- Create a task in your quality management system
- Alert the supervisor
- Log the incident
- Generate a prompt for root cause analysis
- Store the findings
- Recommend corrective actions based on similar past events
All of that happens automatically. The human decision-maker – the supervisor, the engineer – gets the information they need to decide what to do, without having to manually track everything down.
Data and Insight
Here's where digital really shines. With months or years of data automatically collected, you can ask questions paper charts never could answer:
- “Which operator has the lowest scrap rate?” Maybe there's a technique you can teach others.
- “When did our capability start declining?” Look at the data trend. Something changed around that date.
- “Which products are our problem areas?” Chart all products and compare. Focus improvement effort where it matters most.
- “What's our seasonal pattern?” Analysis across years shows if summer heat or winter cold affects your capability.
You're not just responding to today's problems – you're learning from historical patterns to prevent tomorrow's problems.
Mobile and Remote
Digital systems mean you can monitor your process from anywhere. Supervisor on a break? Check the dashboard on their phone. Manager at home on call? Can see immediately if there's an issue. Working across multiple facilities? All visible from one interface.
This doesn't mean people are always working. It means that when something's critical, decision-makers can respond fast.
The Transition
If you're moving from paper to digital, don't abandon everything else. Run both systems in parallel for a while. Let people get comfortable with the new system. Make sure the digital system is actually capturing data correctly. Then gradually shift to trusting the digital process.
Running both systems side by side for a few weeks is your safety net. If the numbers match, you can switch off the paper with confidence.
Your operators need training on the new system. Your supervisors need to understand the dashboards. Your quality team needs to understand how to interpret the new reports. Don't just flip the switch and hope for the best.
The Bottom Line

Paper charts are transparent and tactile – people like that. But digital systems are faster, more accurate, and far more powerful for analysis. For most manufacturers, that trade is worth making.
The best approach? Use digital systems for what they're good at – automated monitoring, analysis, and alerting. Keep the human element strong – operators understanding the process, supervisors investigating signals, engineers improving based on data. That combination is unstoppable.

Ready to put the clipboard down?
Easyr is built for the shop floor – quick for operators, clear for supervisors, and nothing to lose in a notebook. Have a chat with us and we'll show you how it works.
Get in touch